IT remains one of the UK’s largest and best-paid career families, but the market is not growing evenly. Programming dominates employment, London remains the biggest hub, and the strongest long-term demand is for workers who combine technical expertise with judgement, communication and AI literacy.
These statistics use official employment estimates and Skills England scenarios. They describe jobs and skills demand rather than guaranteeing an individual salary or vacancy.
Updated October 2026. Refreshed monthly.
Key Takeaways
- The Digital Sector supported approximately 1.81 million filled jobs in 2025 (Digital Employment Estimates, Oct 2026).
- Priority digital and technology occupations may need 488,000 expansion and replacement workers by 2035 (Skills England, Aug 2026).
- The official average wage for Digital and Technologies companies was £56,000 (DSIT Economic Statistics, Jun 2026).
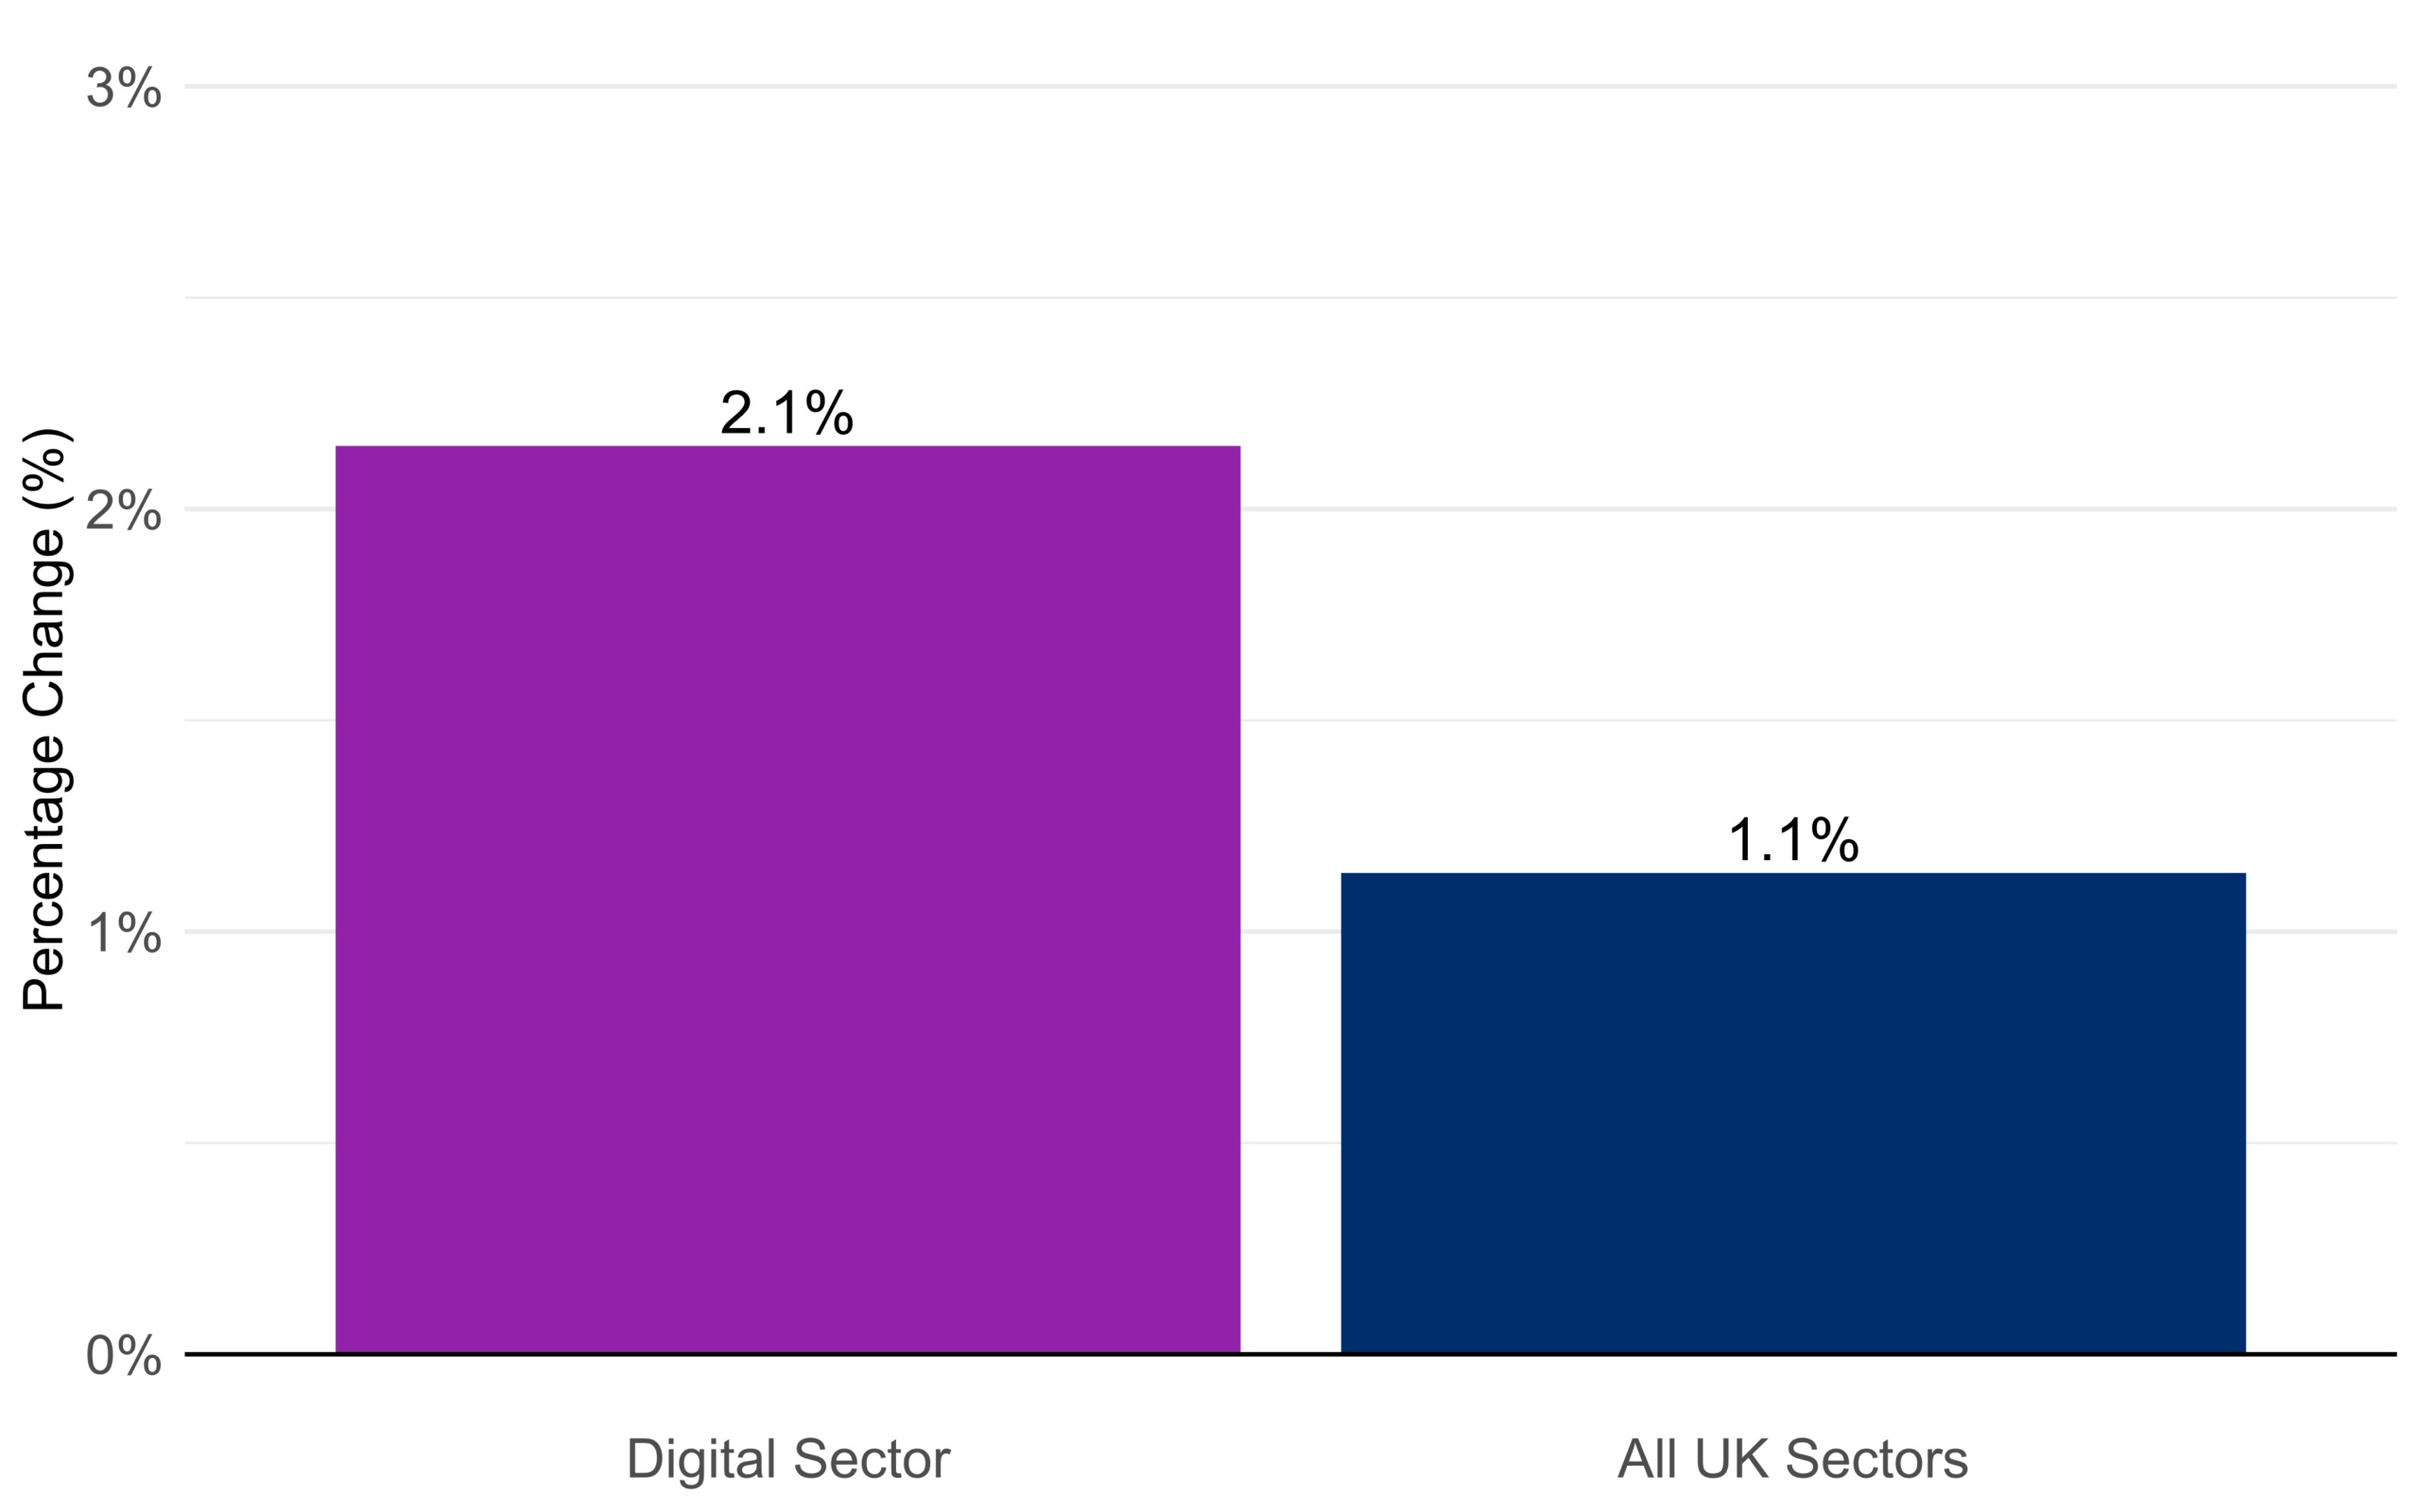
- Digital employment grew 2.1% in 2025, almost twice the 1.1% rate across all UK sectors (Digital Employment Estimates, Oct 2026).
- Programmers and software developers have projected sector demand for 69,000 additional workers (Skills England, Aug 2026).
- Sector pay was estimated to be 49.6% above the all-industry median (DSIT Economic Statistics, Jun 2026).
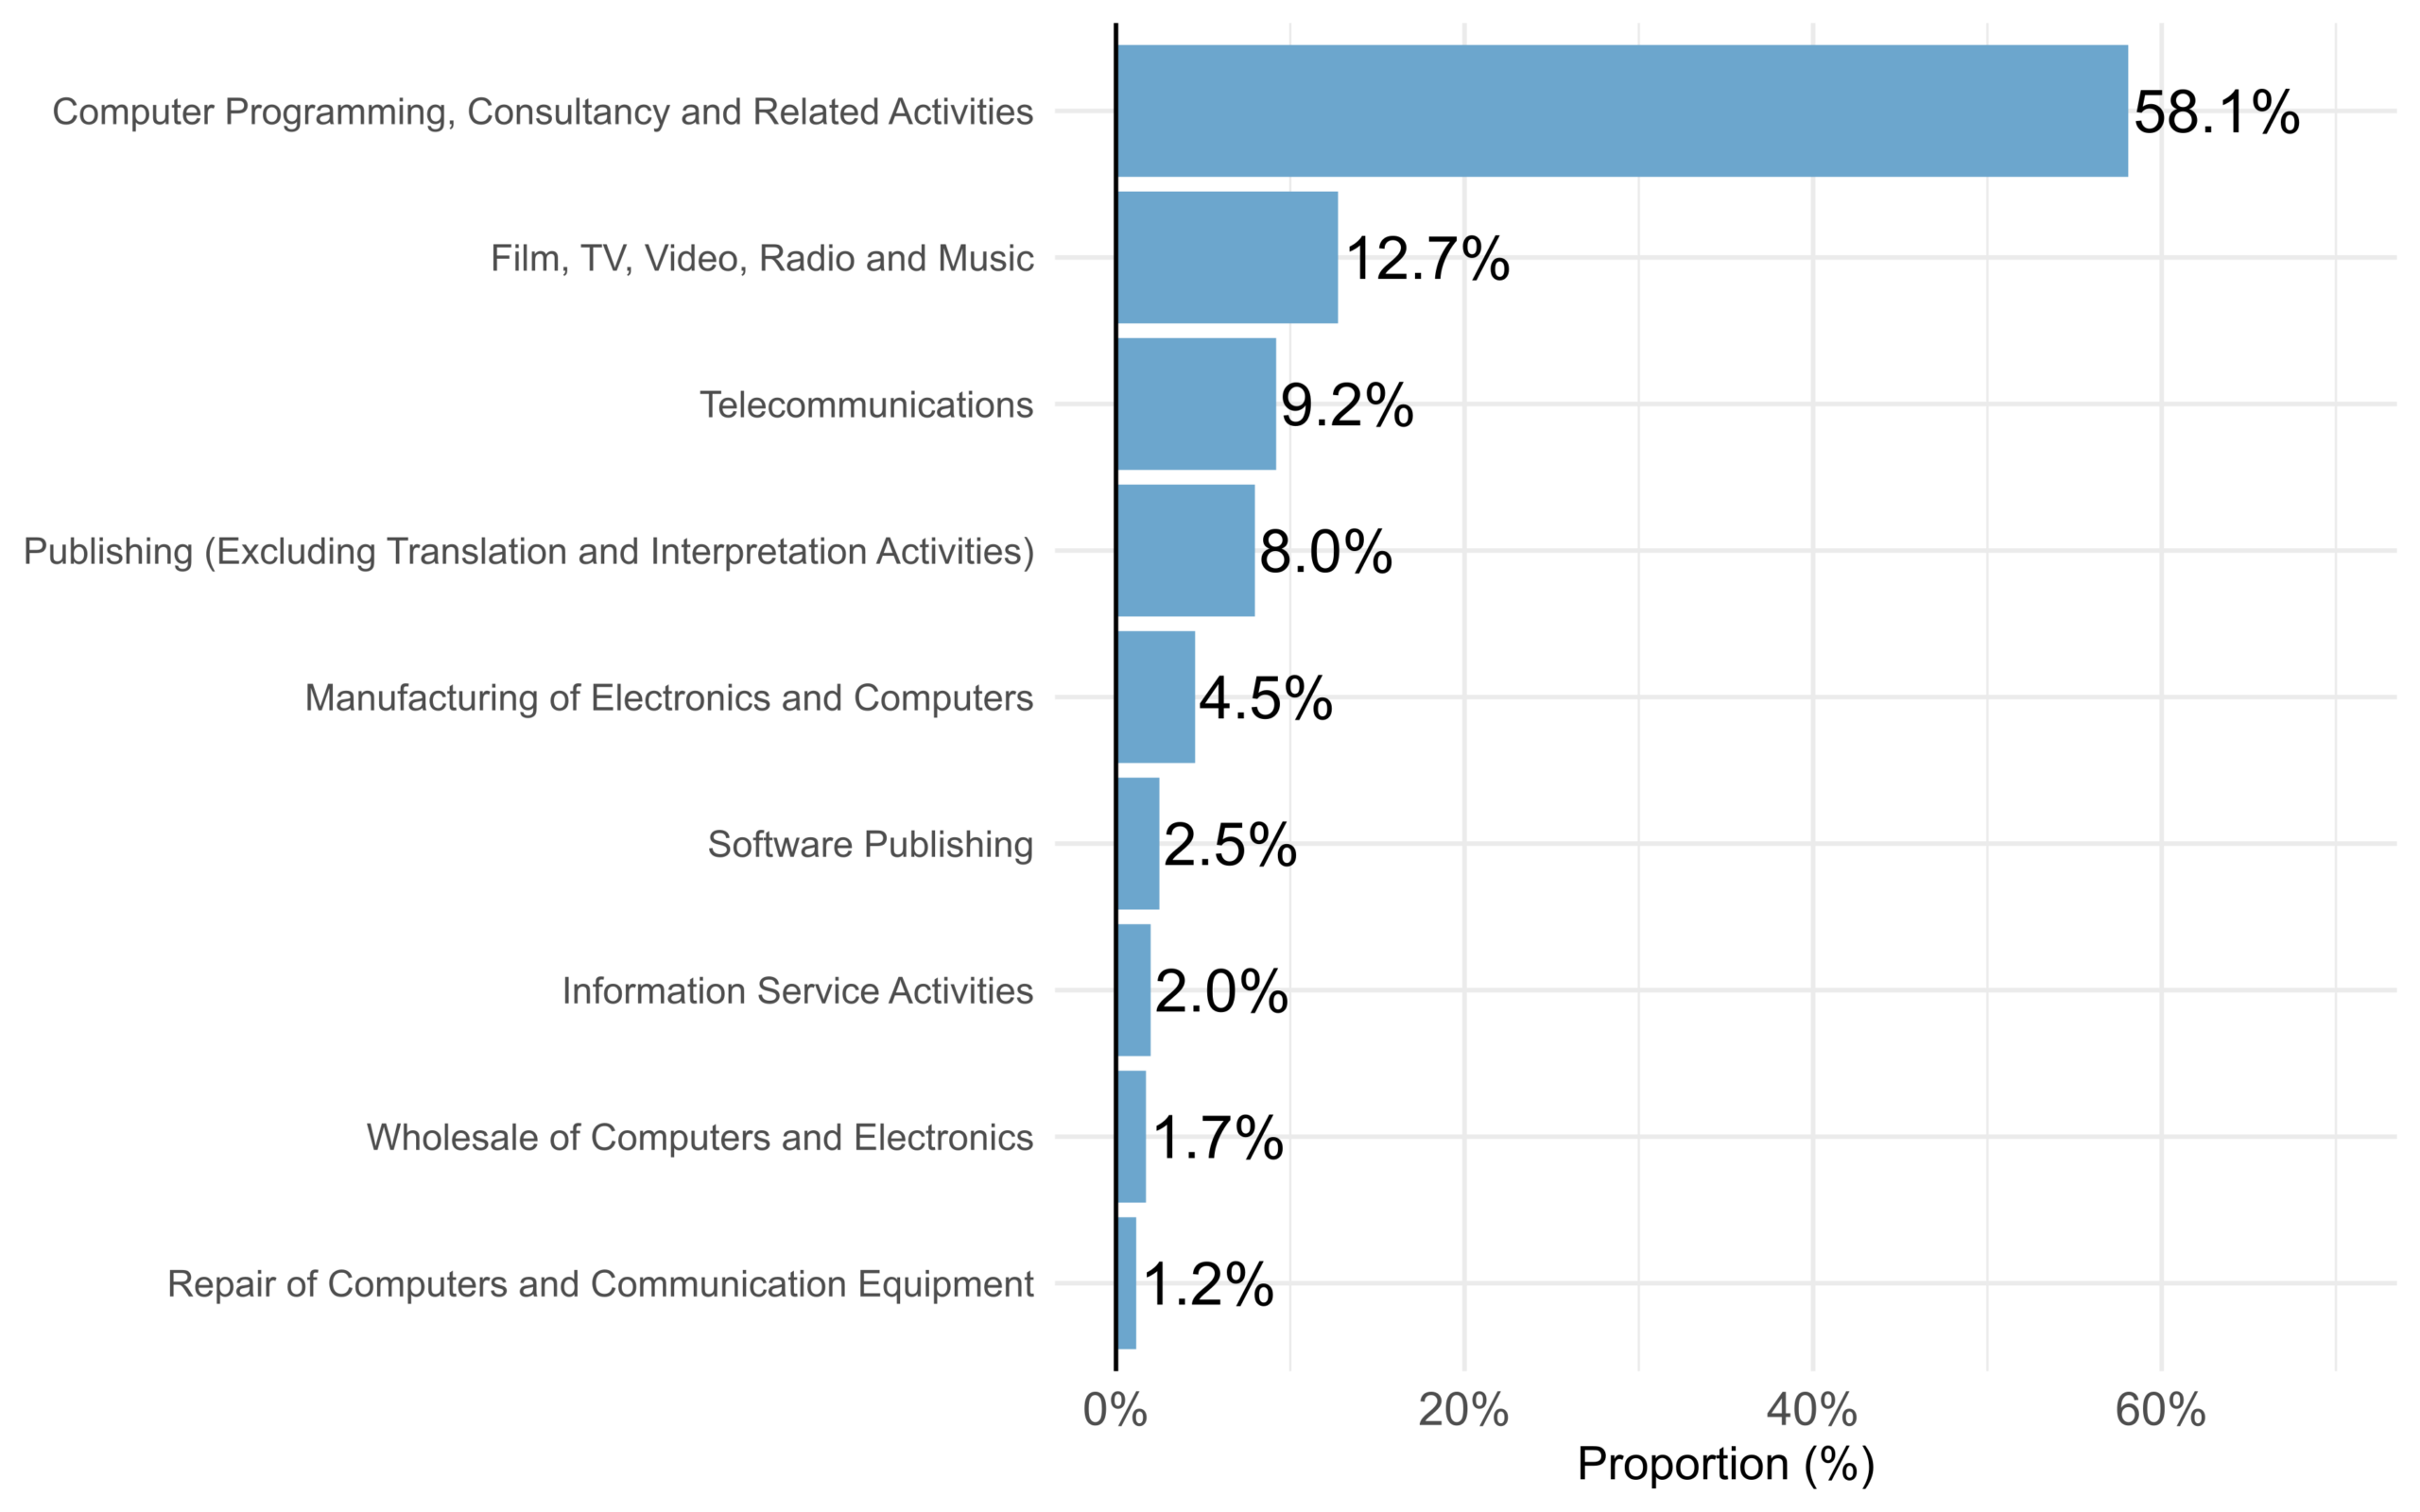
- Programming, consultancy and related work accounted for 58.1% of Digital Sector jobs (Digital Employment Estimates, Oct 2026).
- Sixty-eight percent of priority occupations are already in critical or elevated demand (Skills England, Aug 2026).
- Large technology companies averaged £57,000 in wages per employee (DSIT Economic Statistics, Jun 2026).
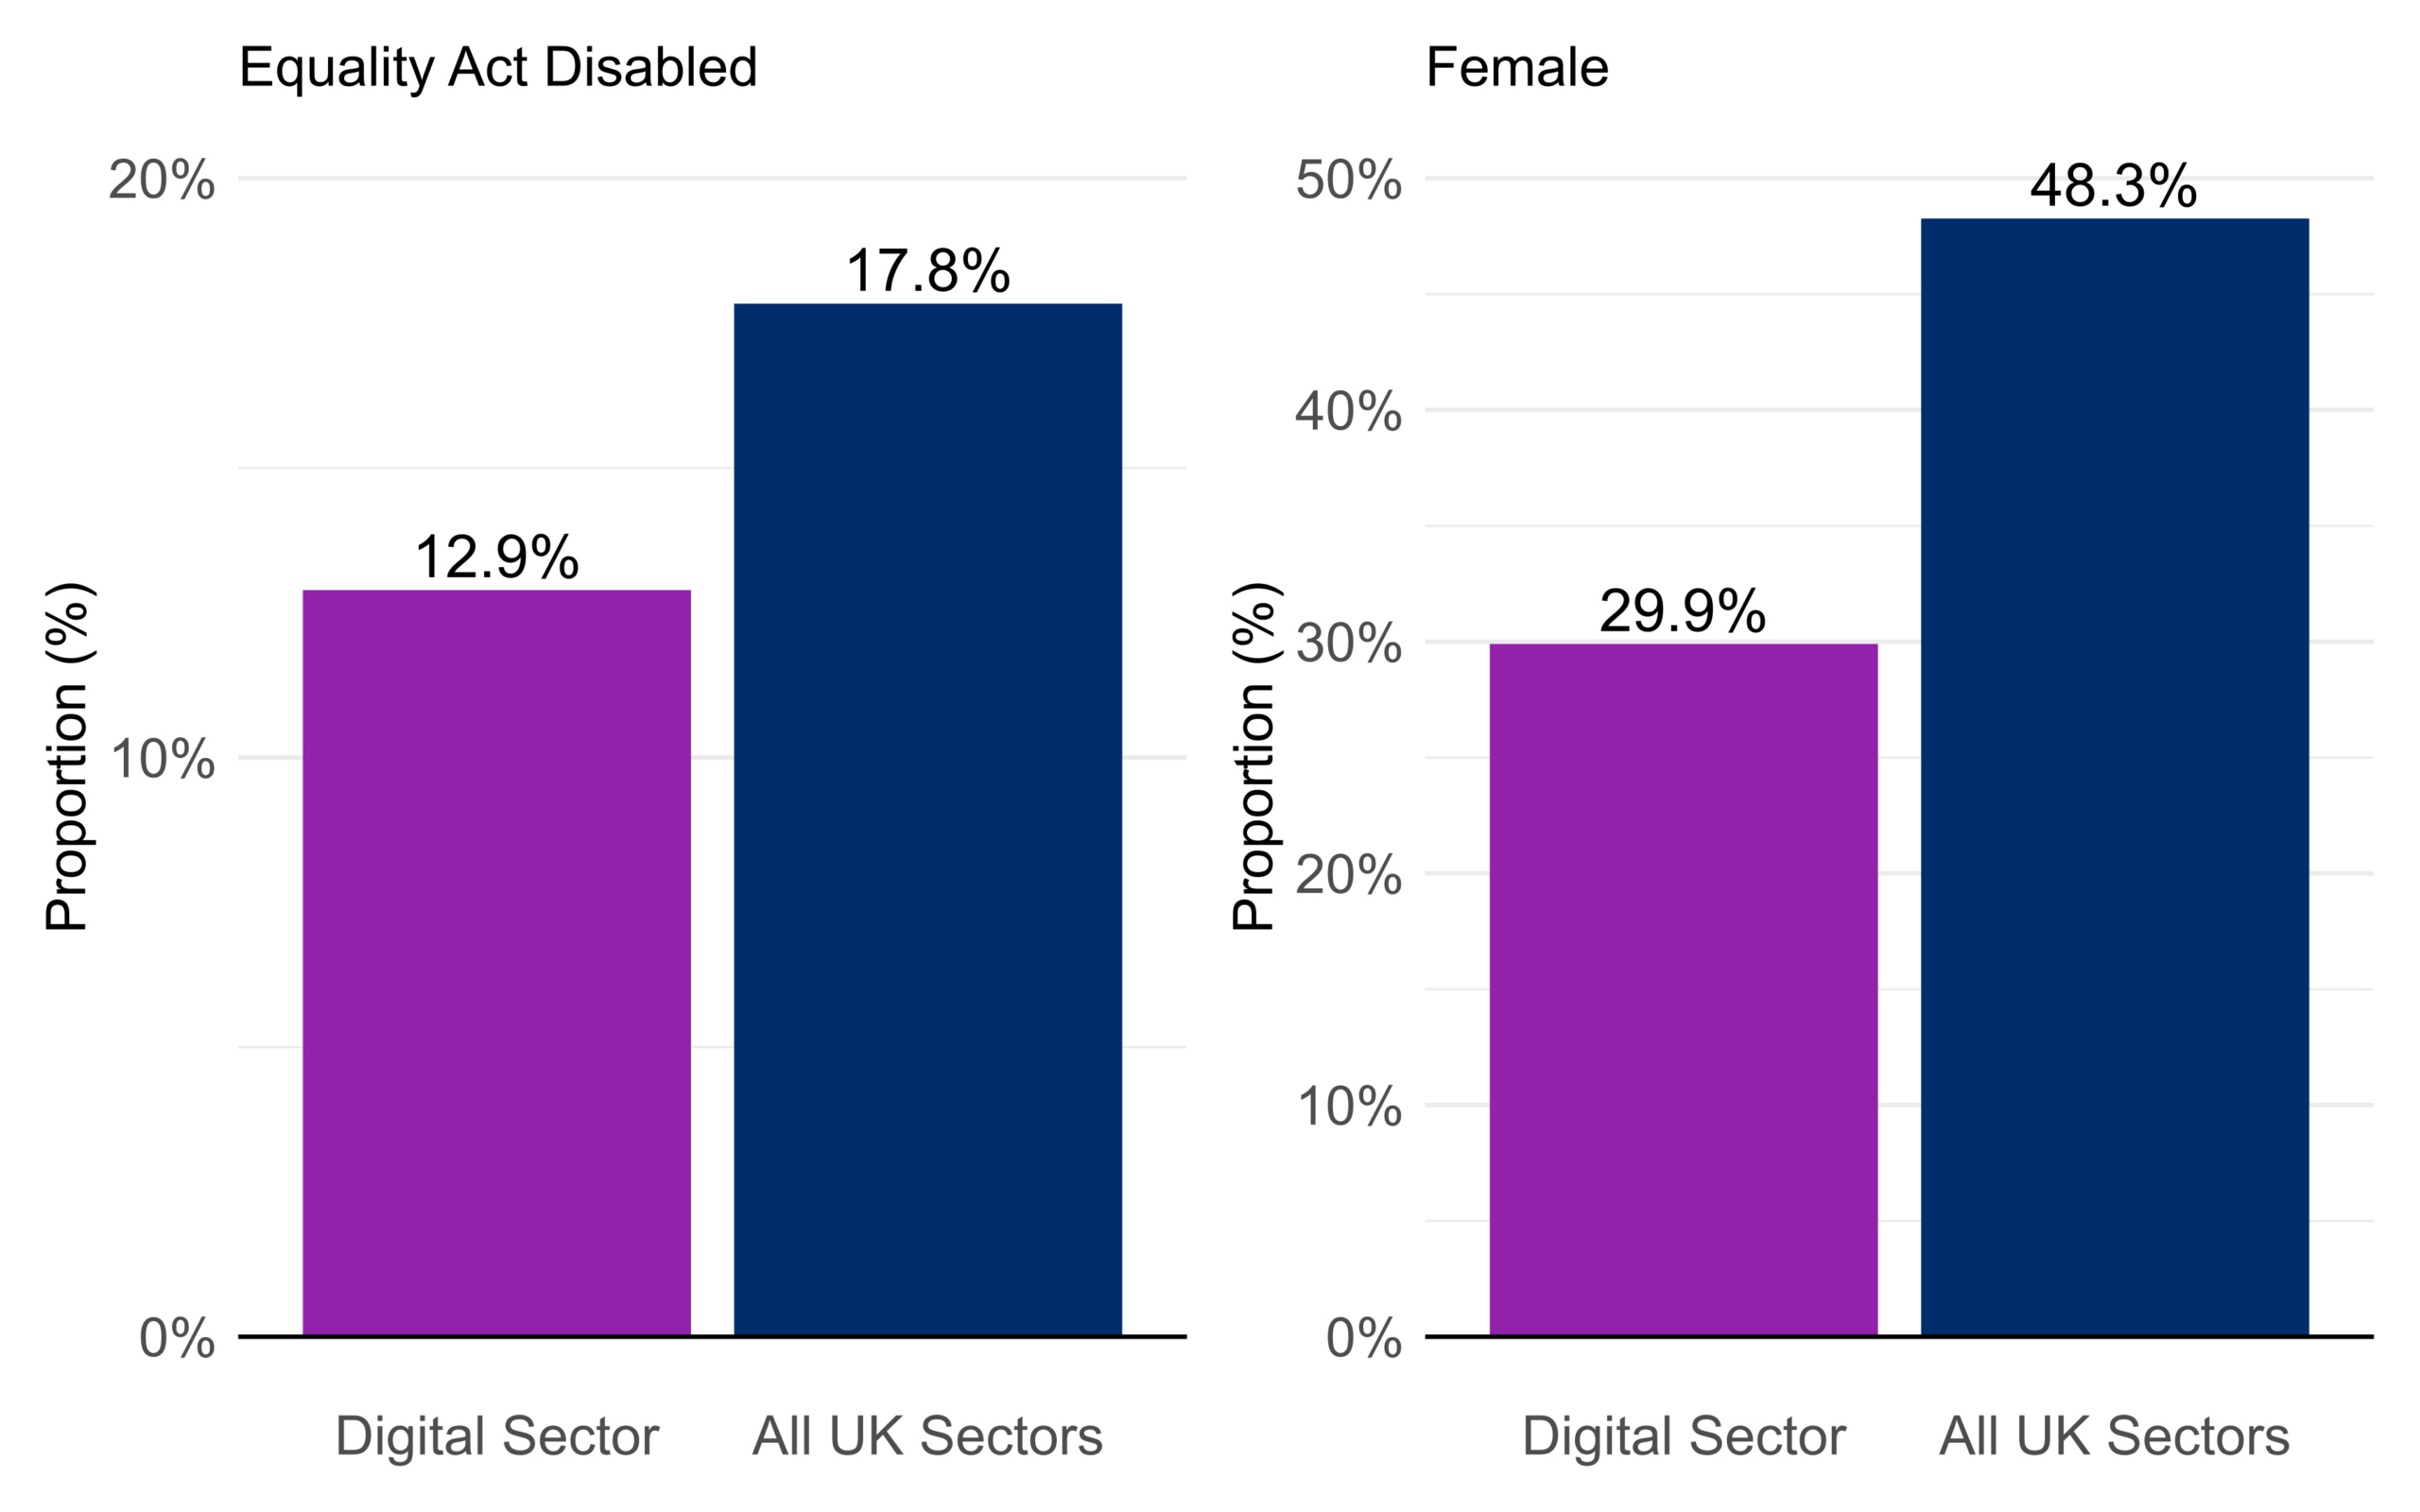
- Women held 29.9% of Digital Sector jobs compared with 48.3% of jobs nationally (Digital Employment Estimates, Oct 2026).
- Eighty-nine percent of projected additional jobs require qualifications at Level 4 or above (Skills England, Aug 2026).
- Small technology companies averaged £43,000 in wages per employee (DSIT Economic Statistics, Jun 2026).
Is UK Digital Employment Growing?
The market returned to growth in 2025, but the rebound followed a sharp 2024 fall and remains statistically uncertain. A single annual percentage cannot describe the whole cycle.
!Percentage growth in UK Digital Sector jobs compared with all UK sectors in 2025 Figure 1: Digital employment grew faster than the wider labour market in 2025. Source: Digital Employment Estimates, Oct 2026. Official chart published by the source, captured 5 Oct 2026.
How has the job count changed?
- Digital employment increased by approximately 38,000 filled jobs from 2024 (Digital Employment Estimates, Oct 2026).
- The 2024 estimate was approximately 1.77 million filled jobs (Digital Employment Estimates, Oct 2026).
- The 2023 estimate was approximately 1.89 million filled jobs (Digital Employment Estimates, Oct 2026).
- The 2022 estimate was approximately 1.88 million filled jobs (Digital Employment Estimates, Oct 2026).
- The 2021 estimate was approximately 1.81 million filled jobs (Digital Employment Estimates, Oct 2026).
- Skills England’s central scenario projects 27% growth in priority occupations between 2025 and 2035 (Skills England, Aug 2026).
- The lower alternative scenario projects 11% growth (Skills England, Aug 2026).
- The broad Digital and Technologies company definition employed an estimated 1.33 million people in 2024 (DSIT Economic Statistics, Jun 2026).
How certain are the estimates?
- The 2025 employment estimate had a lower confidence limit of 1.74 million (Digital Employment Estimates, Oct 2026).
- Its upper confidence limit was 1.87 million (Digital Employment Estimates, Oct 2026).
- The confidence-interval width grew from about 100,000 jobs in 2019 to 130,000 in 2025 (Digital Employment Estimates, Oct 2026).
- The series suppresses breakdowns based on three or fewer respondents (Digital Employment Estimates, Oct 2026).
- Skills England describes its projections as indicative orders of magnitude rather than precise forecasts (Skills England, Aug 2026).
- The central projection assumes future growth resembles the Digital Sector’s long-run 2011 to 2024 pattern (Skills England, Aug 2026).
- Company-based Digital and Technologies employment represented 5.8% of UK company employment (DSIT Economic Statistics, Jun 2026).
Which IT Fields Employ the Most People?
Programming and consultancy tower over every other digital subsector. The latest growth, however, came from a wider mix that included media, publishing, telecoms and software publishing.
!Share of UK Digital Sector employment by subsector in 2025 Figure 2: Programming and consultancy supplied well over half of all Digital Sector jobs. Source: Digital Employment Estimates, Oct 2026. Official chart published by the source, captured 5 Oct 2026.
Which fields are largest?
- Film, television, video, radio and music accounted for 12.7% of jobs (Digital Employment Estimates, Oct 2026).
- Telecommunications accounted for 9.2% (Digital Employment Estimates, Oct 2026).
- Publishing excluding translation and interpretation accounted for 8.0% (Digital Employment Estimates, Oct 2026).
- Electronics and computer manufacturing accounted for 4.5% (Digital Employment Estimates, Oct 2026).
- Software publishing accounted for 2.5% (Digital Employment Estimates, Oct 2026).
- Programmers and software developers are priorities for seven Industrial Strategy sectors (Skills England, Aug 2026).
- IT business analysts, architects and systems designers are priorities for six sectors (Skills England, Aug 2026).
- Frontier-technology companies employed approximately 637,000 people (DSIT Economic Statistics, Jun 2026).
Which fields changed fastest?
- Media added approximately 23,000 jobs and grew 11.1% (Digital Employment Estimates, Oct 2026).
- Programming and consultancy added approximately 17,000 jobs and grew 1.6% (Digital Employment Estimates, Oct 2026).
- Publishing added approximately 11,000 jobs and grew 8.3% (Digital Employment Estimates, Oct 2026).
- Software publishing added approximately 3,000 jobs and grew 7.1% (Digital Employment Estimates, Oct 2026).
- Hardware manufacturing lost approximately 18,000 jobs and fell 18% (Digital Employment Estimates, Oct 2026).
- IT managers are priority occupations in four assessed sectors (Skills England, Aug 2026).
- IT user-support technicians are priority occupations in three sectors (Skills England, Aug 2026).
- Large frontier firms held 74.1% of frontier-technology employment (DSIT Economic Statistics, Jun 2026).
Where Are UK IT Jobs Concentrated?
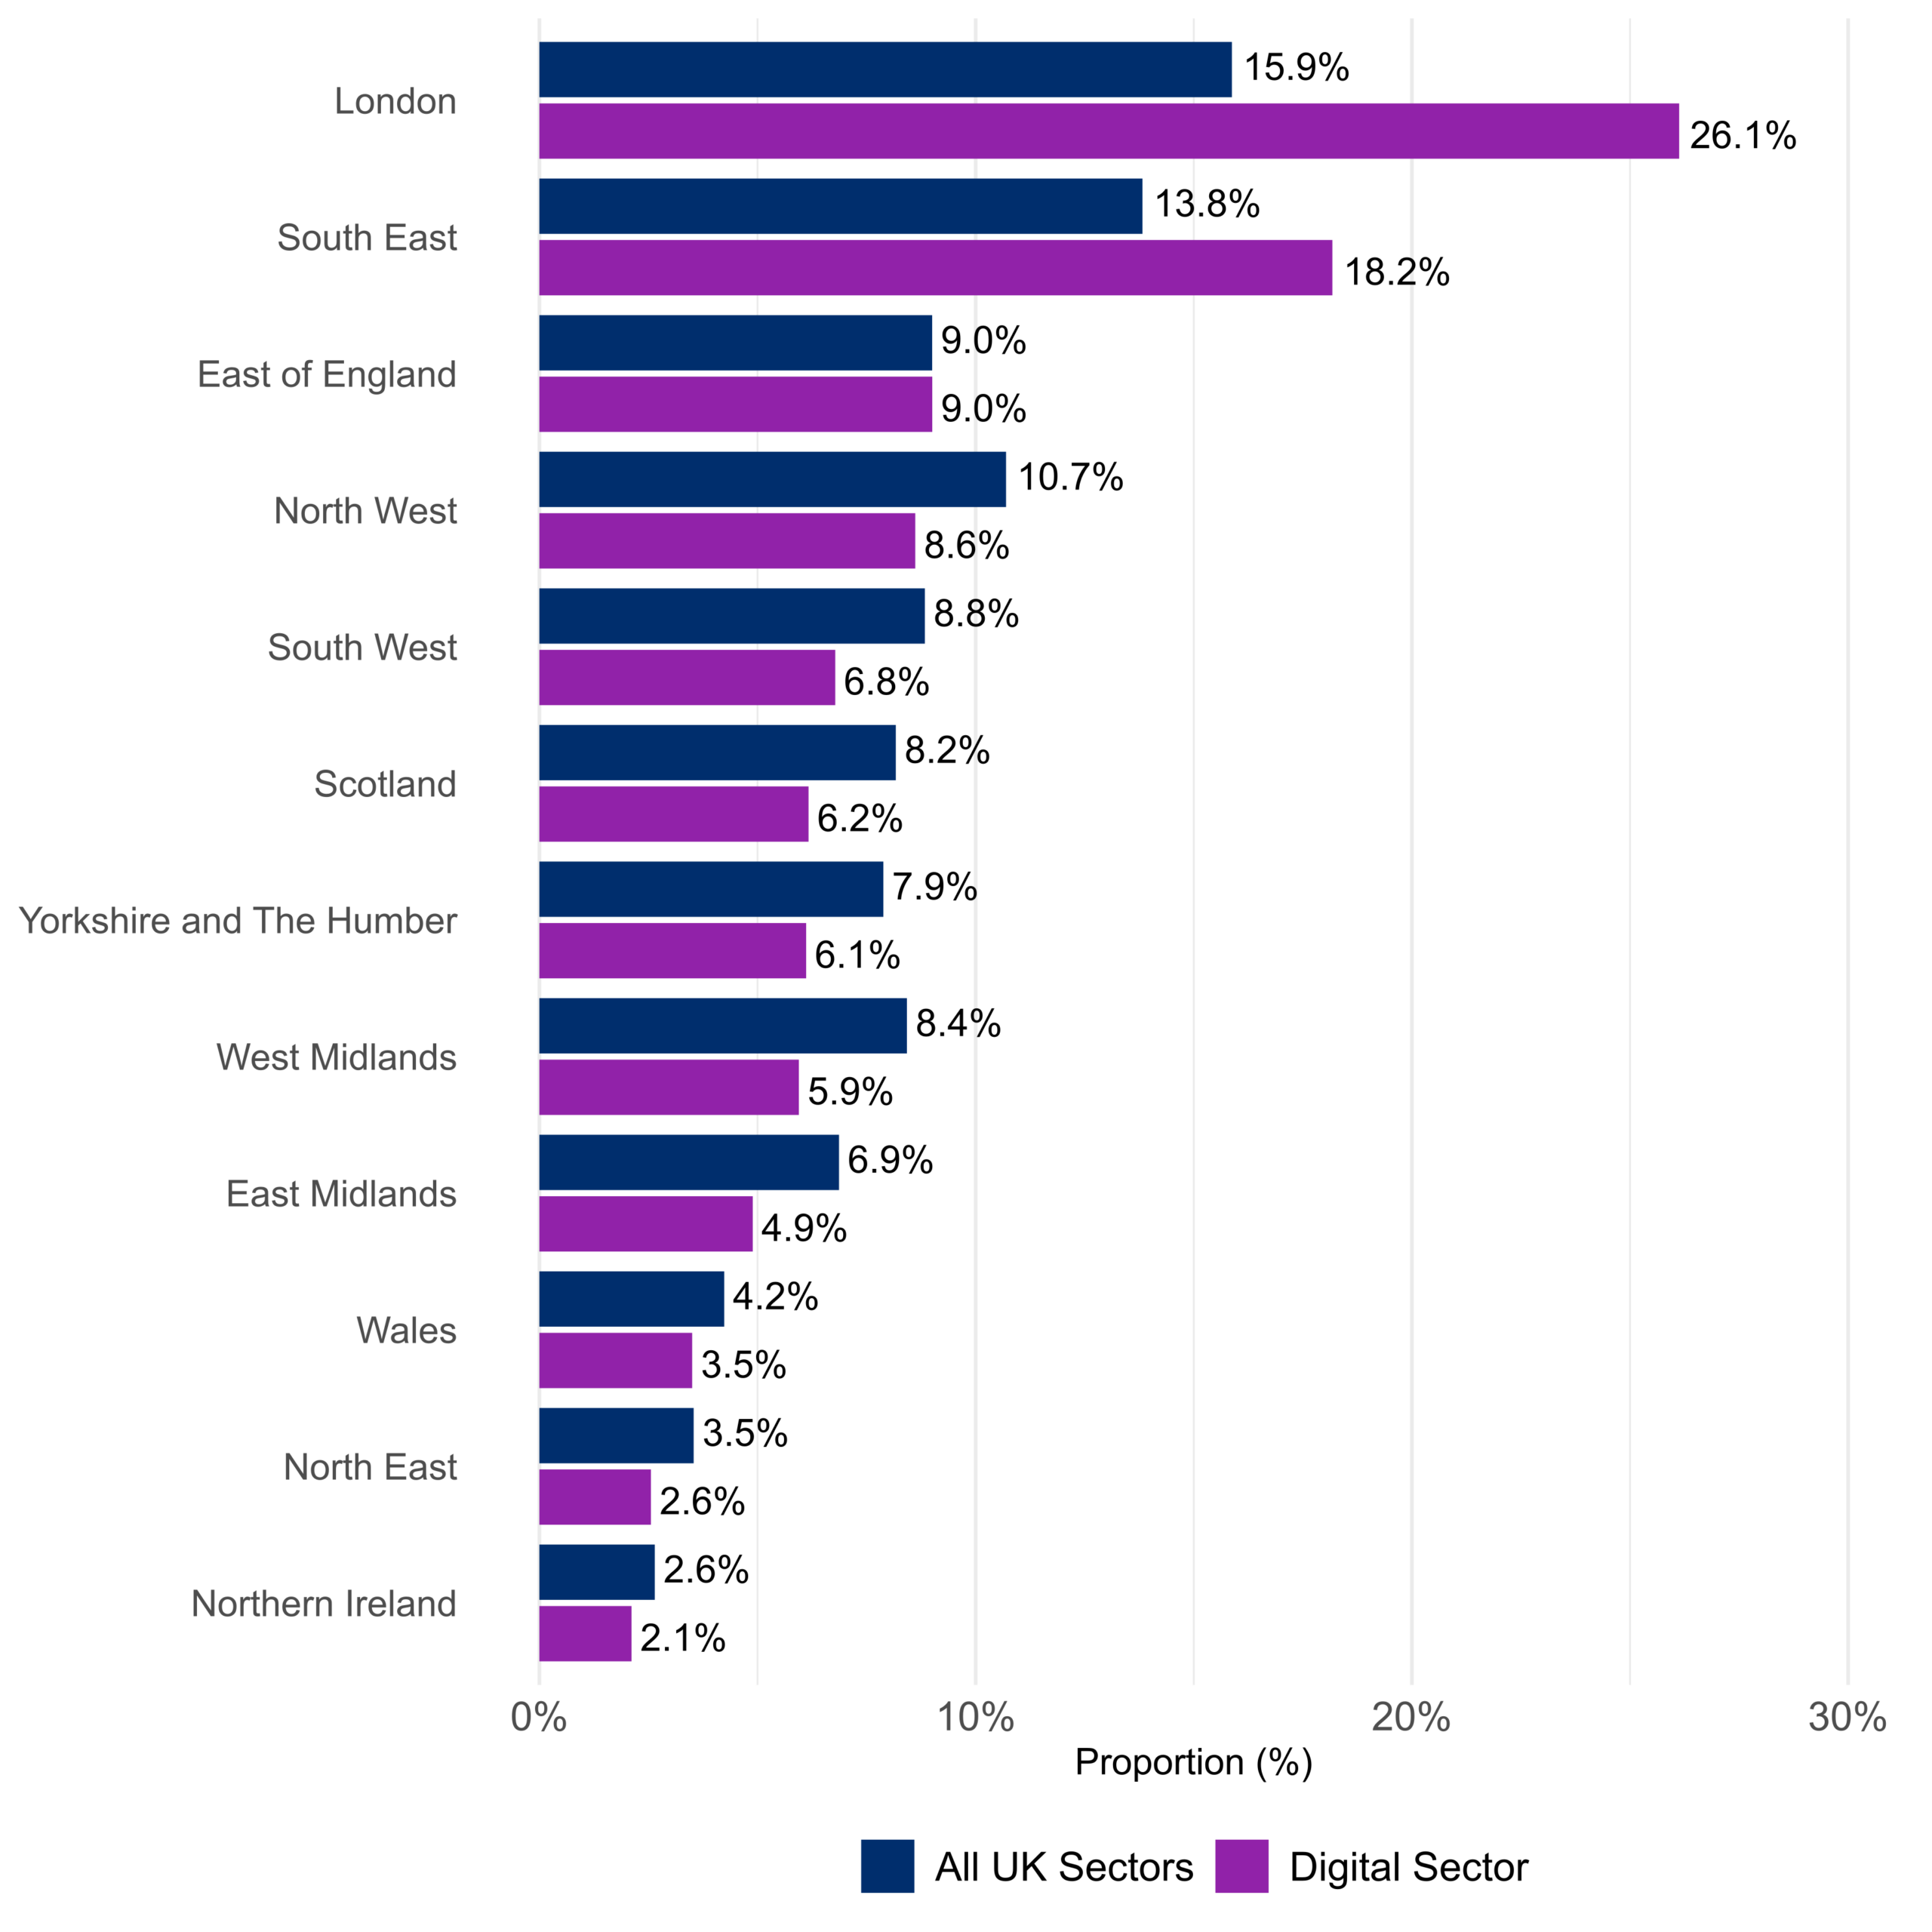
London remains the largest centre, but growth is not confined to the capital. Several smaller regions recorded faster percentage increases, showing why career decisions should consider both scale and momentum.
!Regional shares of UK Digital Sector and all-sector employment in 2025 Figure 3: London and the South East held much larger shares of digital jobs than of employment overall. Source: Digital Employment Estimates, Oct 2026. Official chart published by the source, captured 5 Oct 2026.
Which regions have the most jobs?
- London held 26.1% of Digital Sector employment (Digital Employment Estimates, Oct 2026).
- London contained approximately 470,000 filled digital jobs (Digital Employment Estimates, Oct 2026).
- The South East held 18.2% of Digital Sector employment (Digital Employment Estimates, Oct 2026).
- The South East contained approximately 327,000 filled digital jobs (Digital Employment Estimates, Oct 2026).
- Every other UK region held less than 10% of Digital Sector employment (Digital Employment Estimates, Oct 2026).
- London’s digital and technology employment concentration was 11.3% of regional employment (Skills England, Aug 2026).
- The South East concentration was 9.0% (Skills England, Aug 2026).
- The broad sector’s 107,082 companies are distributed across all UK regions (DSIT Economic Statistics, Jun 2026).
Which regions are changing fastest?
- London added approximately 23,000 digital jobs, a 5.1% rise (Digital Employment Estimates, Oct 2026).
- The North East recorded 24.3% growth, or about 9,000 jobs (Digital Employment Estimates, Oct 2026).
- Wales recorded 14.5% growth, or about 8,000 jobs (Digital Employment Estimates, Oct 2026).
- Scotland recorded 8.8% growth, or about 9,000 jobs (Digital Employment Estimates, Oct 2026).
- The West Midlands recorded a 13.0% fall, or about 16,000 jobs (Digital Employment Estimates, Oct 2026).
- Thames Valley Berkshire has a 16.1% digital and technology employment concentration (Skills England, Aug 2026).
- Central London Forward has a 14.1% concentration (Skills England, Aug 2026).
- Frontier technologies generated 58.0% of broad-sector turnover, reinforcing the value of specialist regional clusters (DSIT Economic Statistics, Jun 2026).
How Diverse Is the Digital Workforce?
The workforce is younger than average and remains markedly male-dominated. Disability representation also trails the wider labour market, while some ethnic groups are represented above their national employment share.
!Disabled and female employment shares in the UK Digital Sector and all sectors Figure 4: Both women and disabled workers held smaller shares of digital jobs than jobs across the economy. Source: Digital Employment Estimates, Oct 2026. Official chart published by the source, captured 5 Oct 2026.
What do gender and disability data show?
- Disabled workers held 12.9% of Digital Sector jobs (Digital Employment Estimates, Oct 2026).
- Disabled workers held 17.8% of jobs across the UK (Digital Employment Estimates, Oct 2026).
- Digital Sector employment included approximately 231,000 disabled workers (Digital Employment Estimates, Oct 2026).
- Female Digital Sector employment totalled approximately 540,000 jobs (Digital Employment Estimates, Oct 2026).
- Close to 70% of the wider Digital and Technologies workforce is male (Skills England, Aug 2026).
- People aged 25 to 34 are 4.7 percentage points more prominent in the sector than nationally (Skills England, Aug 2026).
- Small companies employed approximately 320,000 people in the broad sector (DSIT Economic Statistics, Jun 2026).
What do age and ethnicity data show?
- Asian or Asian British workers held 13.8% of Digital Sector jobs (Digital Employment Estimates, Oct 2026).
- The corresponding national employment share was 8.6% (Digital Employment Estimates, Oct 2026).
- White workers held 77.7% of Digital Sector jobs versus 82.8% nationally (Digital Employment Estimates, Oct 2026).
- Workers aged 16 to 24 held 6.1% of Digital Sector jobs versus 10.6% nationally (Digital Employment Estimates, Oct 2026).
- Workers aged 25 to 34 held 28.7% of Digital Sector jobs (Digital Employment Estimates, Oct 2026).
- The skills assessment cautions that industry classifications can under-represent freelancers and micro-businesses (Skills England, Aug 2026).
- Its demographic estimates use Annual Population Survey data mapped through industry codes (Skills England, Aug 2026).
- Medium-sized companies employed approximately 293,000 people in the broad sector (DSIT Economic Statistics, Jun 2026).
How Much Future Demand Is Expected?
Demand is substantial but uncertain. The responsible reading is a range of scenarios, not a single guaranteed jobs number, especially while AI is changing routine coding and testing work.
!Projected additional employment demand for the top ten UK digital and technology occupations to 2035 Figure 5: Programmers dominate projected demand both inside the sector and across all priority industries. Source: Skills England, Aug 2026. Official chart published by the source, captured 5 Oct 2026.
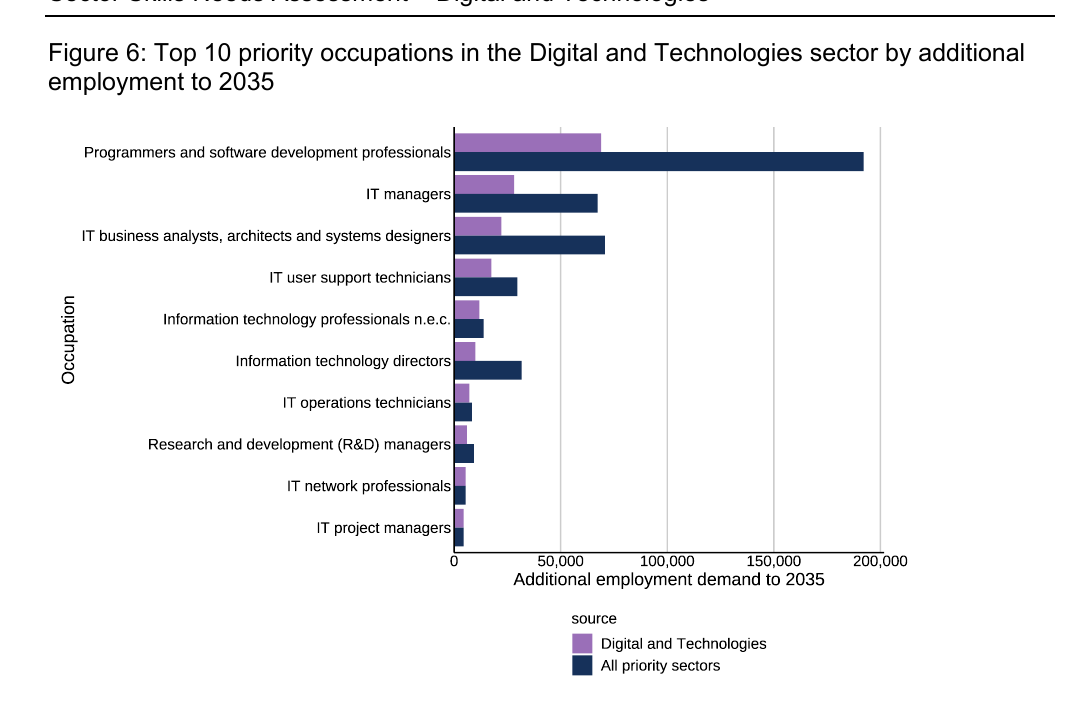
How much expansion and replacement demand is forecast?
- The central scenario adds 239,300 priority-occupation jobs (Skills England, Aug 2026).
- The alternative scenario adds 94,100 jobs (Skills England, Aug 2026).
- The central and alternative growth rates differ by 16 percentage points (Skills England, Aug 2026).
- Annual replacement demand averages 24,900 workers (Skills England, Aug 2026).
- Ten-year replacement demand totals 249,000 workers (Skills England, Aug 2026).
- The model treats current supply as sufficient to maintain the existing workforce, which may not hold for every occupation (Skills England, Aug 2026).
- The UK cyber security workforce reached an estimated 145,900 people (Cyber Security Skills 2026, Sep 2026).
- The cyber security workforce grew by 2%, or about 2,900 people (Cyber Security Skills 2026, Sep 2026).
Which occupations and skills lead demand?
- All priority sectors together may require 192,200 additional programmers and software developers (Skills England, Aug 2026).
- The top technical skill area is developing and deploying applications (Skills England, Aug 2026).
- Another leading skill area is installing, integrating, securing and maintaining digital systems (Skills England, Aug 2026).
- A third is developing digital specifications, controls and policies (Skills England, Aug 2026).
- Priority roles require digital-literacy proficiency of 4.8 versus 3.2 economy-wide (Skills England, Aug 2026).
- Core cyber security job postings increased by 7% (Cyber Security Skills 2026, Sep 2026).
- All cyber security job postings increased by 10% (Cyber Security Skills 2026, Sep 2026).
- Sector productivity of £119,000 GVA per employee helps explain sustained demand for high-skill roles (DSIT Economic Statistics, Jun 2026).
What Qualifications and Entry Routes Matter?
Most projected growth sits above Level 3, but university is not the only route. Apprenticeships, bootcamps and job switching all contribute to the pipeline, and digital apprenticeship completions are rising quickly.
!Expected qualification levels for additional UK digital and technology workers to 2035 Figure 6: Projected digital and technology growth is much more concentrated at Level 4 and above than growth across all priority occupations. Source: Skills England, Aug 2026. Official chart published by the source, captured 5 Oct 2026.
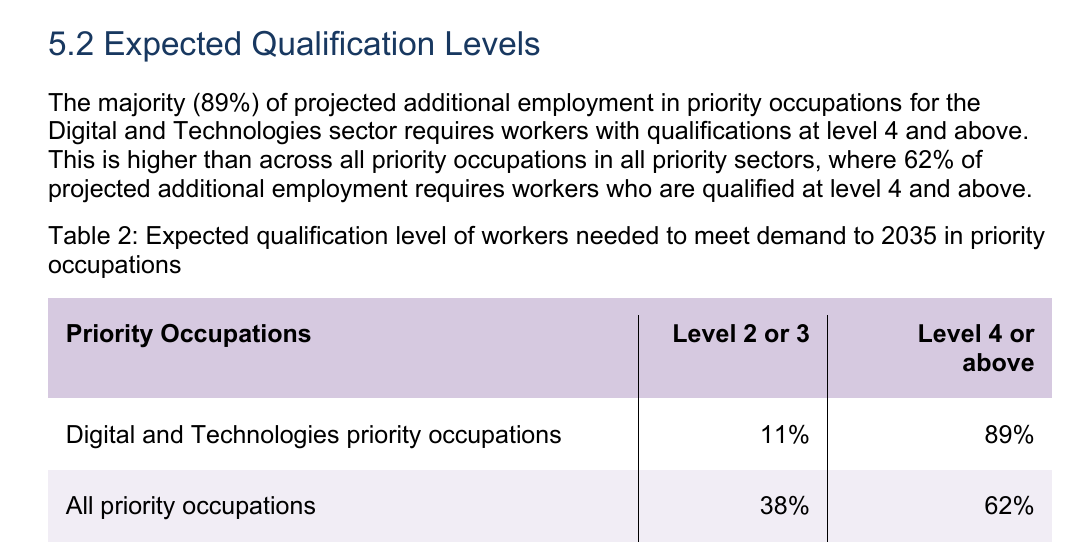
Which education routes supply workers?
- Level 4 and 5 digital apprenticeships supplied 1,040 employed education leavers to priority occupations (Skills England, Aug 2026).
- Level 6+ digital apprenticeships supplied 600 (Skills England, Aug 2026).
- Higher-education computing supplied 7,230 (Skills England, Aug 2026).
- Level 2 and 3 digital apprenticeships supplied 2,200 (Skills England, Aug 2026).
- Higher-education engineering supplied 3,520 (Skills England, Aug 2026).
- Cyber security graduate numbers reached 7,950 (Cyber Security Skills 2026, Sep 2026).
- Cyber security graduate numbers grew by 14% between the 2022/23 and 2023/24 academic years (Cyber Security Skills 2026, Sep 2026).
- The £56,000 broad-sector average wage indicates the value placed on qualified labour (DSIT Economic Statistics, Jun 2026).
Are training routes growing fast enough?
- Level 4 and 5 digital apprenticeship achievements reached 4,190 and grew 82% (Skills England, Aug 2026).
- Level 2 and 3 achievements reached 6,960 and grew 49% (Skills England, Aug 2026).
- Level 6+ digital apprenticeship achievements reached 1,840 and grew 46% (Skills England, Aug 2026).
- Higher-education computing achievements reached 50,280 and grew 40% (Skills England, Aug 2026).
- Digital skills bootcamp achievements increased from 6,850 to 7,380 (Skills England, Aug 2026).
- Approximately 8,600 people entered cyber security through formal education and training pathways in 2025 (Cyber Security Skills 2026, Sep 2026).
- The estimated annual cyber workforce supply requirement for 2026 is 10,200 people (Cyber Security Skills 2026, Sep 2026).
- Medium-sized technology companies averaged £55,000 in wages per employee (DSIT Economic Statistics, Jun 2026).
Methodology and Sources
This article uses official UK employment estimates, Skills England planning scenarios and DSIT company statistics. Filled jobs are not the same as people, company-sector definitions differ from occupation definitions, and future-demand figures are scenarios rather than guarantees. Sources are checked monthly and the article is refreshed when an official release changes the evidence.
Glossary
- ASHE: Annual Survey of Hours and Earnings.
- Filled job: An occupied employee or self-employment job.
- Level 4: Qualifications above A level and below or including degree-level routes, depending on the qualification.
- Priority occupation: A role identified as important to one or more Industrial Strategy sectors.
- Replacement demand: Workers needed to replace people leaving an occupation.
- SOC: Standard Occupational Classification.
- SIC: Standard Industrial Classification.
Sources
- Digital Employment Estimates, Oct 2026.
- Skills England, Aug 2026.
- DSIT Economic Statistics, Jun 2026.
- Cyber Security Skills 2026, Sep 2026.